How to read Bitcoin ETF flow numbers
On this page
Since US spot Bitcoin ETFs started trading in January 2024, daily “inflow” and “outflow” figures have become a regular market headline. They are useful, but only if you know what they count and what they leave out.
What a flow actually is
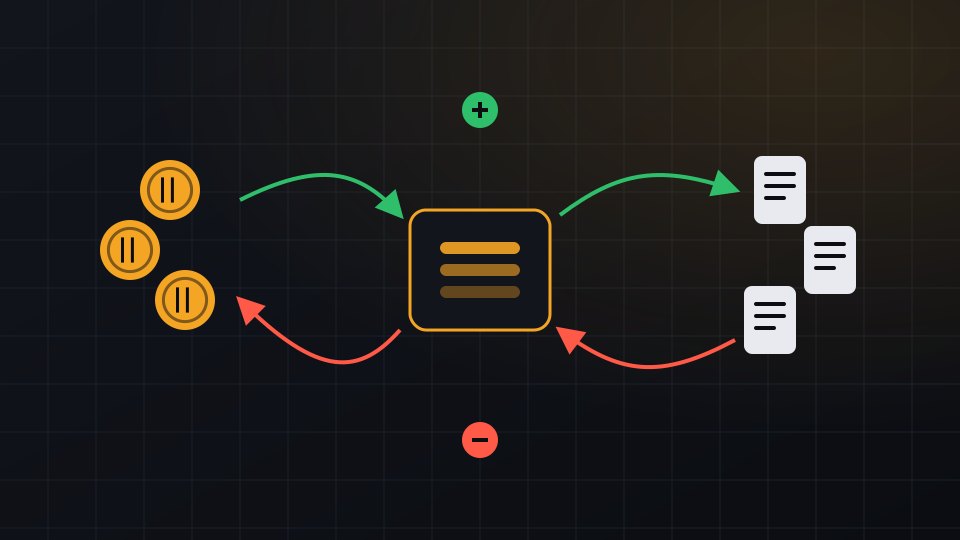
An exchange-traded fund issues and cancels its own shares through large market participants called authorized participants. When demand for the fund’s shares is higher than supply, new shares are created and the fund buys more bitcoin to back them. When shares are redeemed, the fund holds less bitcoin.
A daily net inflow means more shares were created than redeemed that day; a net outflow means the opposite. The dollar figure is the value of that change, not the value of all trading in the fund.
Flows are not the same as trading volume
Most buying and selling of ETF shares happens between investors on the stock exchange. Those trades change who owns the shares but not how many exist, so they do not show up as flows at all.
That is why a fund can trade heavily on a day with almost no flow, and why a large flow does not always mean the price of bitcoin moved by a similar amount.
How to read a run of flow numbers
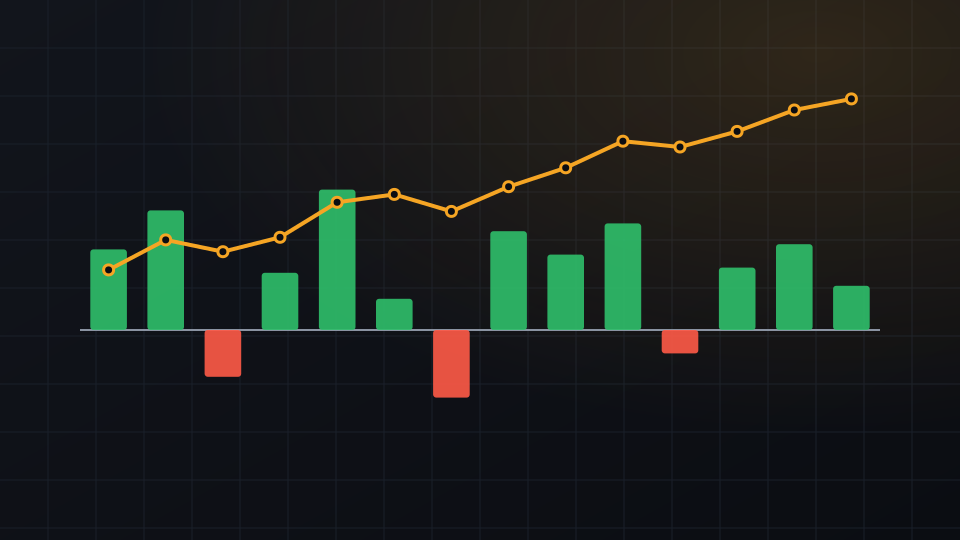
- Look at the trend, not one day. A single large day can come from one institution rebalancing. Several days in the same direction say more.
- Check the timing. Flow figures are usually reported after the US market closes or the next morning, so they describe what already happened.
- Add the funds together. One issuer gaining while another loses can simply be investors switching between funds.
- Compare with price. Inflows while the price falls, or outflows while it rises, are worth noting because the two are moving apart.
What flows cannot tell you
Flows show demand from people who choose to buy bitcoin through a fund. They do not include buying on crypto exchanges, holdings in other countries’ products or coins held directly. They also say nothing about why investors bought or sold, or what they will do next.
For education only, not financial advice. Crypto assets and stocks are volatile, and leveraged positions can lose more than the money you put in.
Get one like this every week
A five-minute market brief in your inbox each Monday. Free, unsubscribe anytime.
Or follow the Telegram channel @isoskwllsMarket now
Latest news